AirNet sensors Data Quality Validation Service
De Zilvermeeuw, Vriezenveen, Netherlands

Share: aqicn.org/station/validation/@379651/

Welcome to the AirNet Sensor Data Quality Validation service.

Station: De Zilvermeeuw, Vriezenveen, Netherlands also known as "Citizen Science project sensor.community 80578"
located at "De Zilvermeeuw, Vriezenveen, Twenterand, Overijssel, Netherlands, 7671LN, Netherlands".

--

Sensor data validation is done by looking at both the standalone sensor data (when the sensor is producing minute-level data) and the comparative data (when the sensor is co-located with other sensors).

Standalone Data Quality

In order to ensure the highest level of data quality, the signal to noise ratio (SNR), defined as the coefficient of variation from the hourly readings, should be relatively low (below 33%).

Any measurement with SNR constantly higher than 10% could be biased because of incorrect sensor readings (such as defective fan or dust accumulation).

Show me the data

Comparative Data Quality

In order to compare the sensor data with the co-located sensor, the "data readings confidence zone" graph is used, where the red line represents the hourly readings from the sensor, while the green line represents the median of the hourly readings of the station neighbors.

The zone filled in green represents the confidence zone, equivalent to 3 times the standard deviation of the neighbor stations.

Each time the station hourly reading goes above the confidence zone, the station is considered producing abnormal reading.

The larger the difference between the hourly reading and confidence zone, the more likely the station is considered as producing invalid data.

The formula is defined as:

\( d_i = {v_i - median_i \over {stddev_i }} \) , \( P = \sum_i ( \begin{cases} 1/n & d_i>5 \\ 0 & otherwise \end{cases} ) \) , \( D = \sqrt {\sum_i {d_i} \over n} \)
P=probability, D=distance and W=P*D

where 'i' is iterated over the past 3 days data and 'n' is the number of samples during those past 3 days (most likely n = 24*3).

If W>30, the station is automatically disabled.

Show me the data

Further questions

If you have any question or comment, send us a message using the form below:
Show me the standalone data

Show me the comparative data

Show me the historical data

Know any Air Quality station in your surroundings?
Participate with your own air quality monitoring station

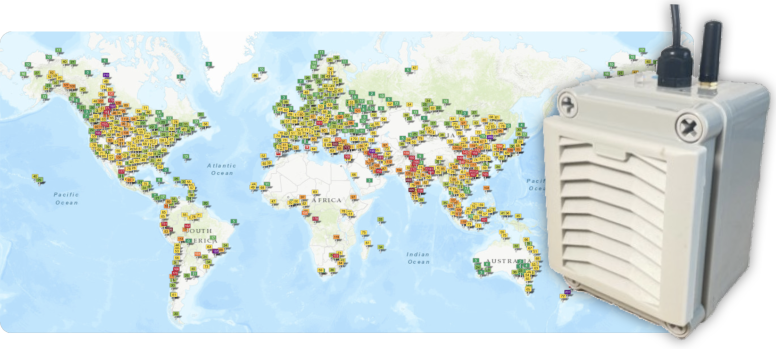
Our GAIA air quality monitors are very easy to set up: You only need a WIFI access point and a USB compatible power supply.

Once connected, your real time air pollution levels are instantaneously available on the maps and through the API.

The station comes with a 10-meter water-proof power cable, a USB power supply, mounting equipment and an optional solar panel.

About the Air Quality and Pollution Measurement:

About the Air Quality Levels

AQI Air Pollution Level Health Implications Cautionary Statement (for PM2.5)
0 - 50 Good Air quality is considered satisfactory, and air pollution poses little or no risk None
51 -100 Moderate Air quality is acceptable; however, for some pollutants there may be a moderate health concern for a very small number of people who are unusually sensitive to air pollution. Active children and adults, and people with respiratory disease, such as asthma, should limit prolonged outdoor exertion.
101-150 Unhealthy for Sensitive Groups Members of sensitive groups may experience health effects. The general public is not likely to be affected. Active children and adults, and people with respiratory disease, such as asthma, should limit prolonged outdoor exertion.
151-200 Unhealthy Everyone may begin to experience health effects; members of sensitive groups may experience more serious health effects Active children and adults, and people with respiratory disease, such as asthma, should avoid prolonged outdoor exertion; everyone else, especially children, should limit prolonged outdoor exertion
201-300 Very Unhealthy Health warnings of emergency conditions. The entire population is more likely to be affected. Active children and adults, and people with respiratory disease, such as asthma, should avoid all outdoor exertion; everyone else, especially children, should limit outdoor exertion.
300+ Hazardous Health alert: everyone may experience more serious health effects Everyone should avoid all outdoor exertion

To know more about Air Quality and Pollution, check the wikipedia Air Quality topic or the airnow guide to Air Quality and Your Health.

For very useful health advices of Beijing Doctor Richard Saint Cyr MD, check www.myhealthbeijing.com blog.


Usage Notice: All the Air Quality data are unvalidated at the time of publication, and due to quality assurance these data may be amended, without notice, at any time. The World Air Quality Index project has exercised all reasonable skill and care in compiling the contents of this information and under no circumstances will the World Air Quality Index project team or its agents be liable in contract, tort or otherwise for any loss, injury or damage arising directly or indirectly from the supply of this data.


Settings


Language Settings:


Temperature unit:
Celcius